Practice ・ 6 min
Do actively managed funds beat the market? Luck vs skill
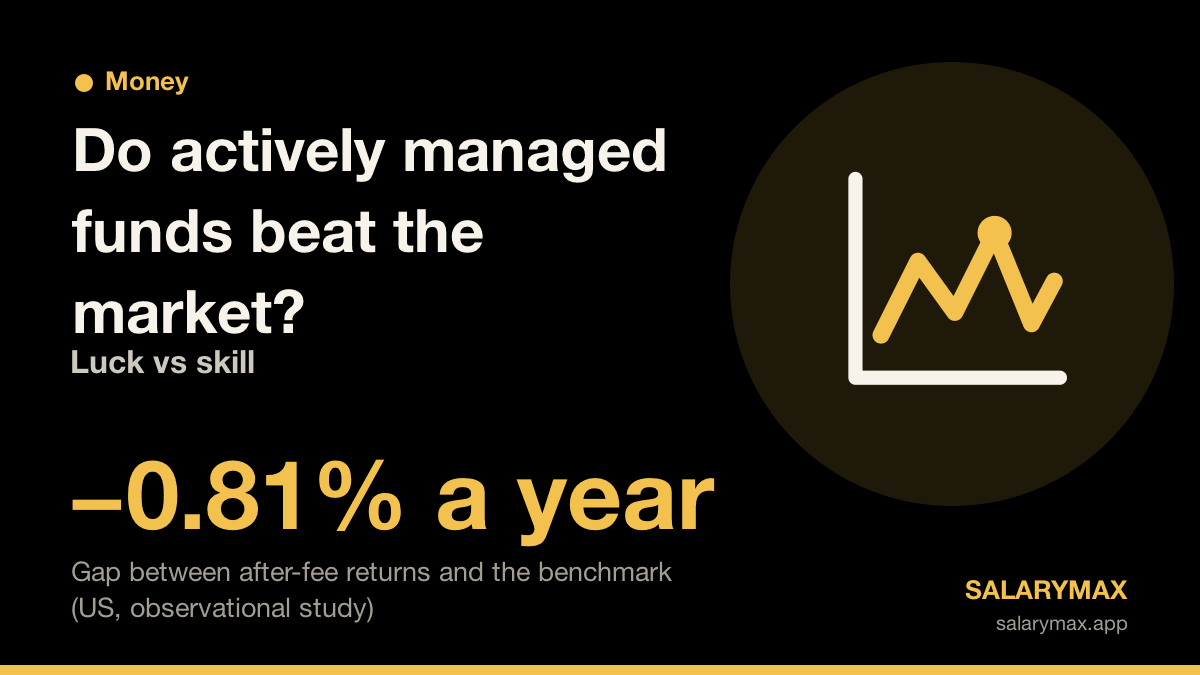
A US study of active equity funds (1984–2006) found that after fees they trailed benchmarks by 0.81–1.00% a year. Before fees they roughly matched the market.
The evidence behind this article
- Adjusted observational4
- Estimate1
Based on observational data. It shows that two things go together, not that one causes the other.
5 sources・Countries studied: United States, Japan
How to read the kinds of evidence →What to do with this
If you hold investment funds, write down the yearly cost rate of each one and work out what it comes to in money over a year.
Can “active” funds, where professional managers pick the stocks, beat the market average? A study of US equity mutual funds over more than 20 years found that, after fees, active funds as a group fell short of benchmarks built from market movements. This article walks through that study and research from Japan. It does not recommend any product or investment approach.
Key points
- A study of US actively managed equity mutual funds (index funds excluded) from 1984 to 2006 found that returns after fees trailed benchmark returns by 0.81–1.00% a year. It is an analysis of observational data.
- In the same study, when fund expenses were added back, the group’s performance was close to the benchmark. Active funds as a whole held something close to the market, and most of the gap came from costs.
- Studies of Japanese equity funds (1981–1992 and 2011–2016) also found that most funds did not beat their benchmarks. How best to detect genuinely skilled funds is still debated among researchers.
After fees, how did active funds compare with the market?
Eugene Fama and Kenneth French used the CRSP database of US security prices to study actively managed mutual funds investing in US stocks from January 1984 to September 2006. Index funds were left out.
They measured performance after removing what could be explained by movements anyone could copy: the market as a whole, and the returns of small stocks and cheap “value” stocks. What is left is called “alpha”. Measured on the returns investors actually received, after fees, alpha was between −0.81% and −1.00% a year.
When the costs in fund expense ratios were added back, the asset-weighted alpha was 0.13% a year, essentially zero. The authors conclude that, before expenses, active funds in aggregate held a portfolio that behaved almost exactly like the market. What investors kept was reduced by the high expenses of active management.
Were the winners lucky or skilled?
Are there at least some funds with real skill? The authors took 3,156 funds that had passed $5 million in assets and simulated, 10,000 times, a world in which every fund’s true alpha is zero. They then compared the spread of real fund results with the spread that luck alone would produce.
The result: after fees, few funds appeared to earn enough to cover their costs. Before fees, there were signs of both inferior and superior managers in the two tails, but the differences were not large.
Mark Carhart studied US equity funds using data that also kept funds that later closed. The apparent tendency for winners to keep winning was almost entirely explained by common patterns in stock returns and by expenses. The clear pattern left over was that the worst funds kept doing badly.
There is research from Japan too. A study of Japanese open-type equity funds from 1981 to 1992 found that, whatever the measure, most funds trailed their benchmarks by 3.6% to 10.8% a year. A study of 355 actively managed Japanese equity funds from April 2011 to April 2016 found that, as a group, they failed to beat a four-factor benchmark. Using the same simulation idea as Fama and French, a large share of funds did not beat a world with no skill. Poor performance persisted more than strong performance.
What can active-fund research tell us?
This evidence supports one statement: in US and Japanese data, active funds as a group earned less than their benchmarks after fees. All of these are analyses of past, observational data, not forecasts.
- These are averages. Some funds beat the benchmark in a given period, but telling luck from skill using past returns is hard.
- The method is debated. Campbell Harvey and Yan Liu argued that the Fama-French approach tends to miss funds that really do have large alphas, while a competing method tends to find skill too often. So the research does not show that no skilled funds exist.
- Times and countries differ. The US results cover 1984–2006, the Japanese results 1981–1992 and 2011–2016. Fee levels and the range of products may be different today.
A small step for today
Which product to choose is a personal decision. What the research does support is that costs are easier to see in advance than future performance.
- If you hold investment funds, write down the yearly cost rate of each and turn it into a money amount. It works like the app habit “Reviewed one fixed cost”.
- Do not choose by past performance rankings alone. Research has not shown that good past results tend to continue.
- Note in one line why you bought a fund and what it costs, in the spirit of “Tracked spending”. It gives you something to check against later.
FAQ
Do actively managed funds do worse than index funds?
In the US study covering 1984–2006, active equity funds as a group trailed benchmarks based on market movements by 0.81–1.00% a year after fees. That is an average for the whole group, not a prediction for any single fund.
Can I win by picking funds that did well in the past?
The research does not support that. In the US study, apparent persistence was mostly explained by common market patterns and costs, and the clear persistence was among the worst funds staying bad. The 2011–2016 Japanese study also found that poor performance persisted more.
Are the results the same for Japanese funds?
Studies of Japanese equity funds found that from 1981 to 1992 most funds trailed their benchmarks by 3.6–10.8% a year, and that 355 funds studied from 2011 to 2016 did not beat their benchmark as a group. The periods are limited, so the results may not apply directly to today’s products.
Sources
- [X-fama-french-2010] Fama & French (2010) Luck versus Skill in the Cross-Section of Mutual Fund Returns. The Journal of Finance.
- [X-carhart-1997] Carhart (1997) On Persistence in Mutual Fund Performance. The Journal of Finance.
- [X-harvey-liu-2022] Harvey & Liu (2022) Luck versus Skill in the Cross Section of Mutual Fund Returns: Reexamining the Evidence. The Journal of Finance.
- [X-cai-chan-yamada-1997] Cai, Chan & Yamada (1997) The Performance of Japanese Mutual Funds. The Review of Financial Studies.
- [X-pilbeam-preston-2019] Pilbeam & Preston (2019) An Empirical Investigation of the Performance of Japanese Mutual Funds: Skill or Luck? International Journal of Financial Studies.
Studies describe average tendencies. This article is not a promise that a habit will lift your income, and it is not medical or investment advice. About these articles ・ Search & sources
Updated:
← All articles