Basics ・ 6 min
Does frequent stock trading hurt returns? A US study
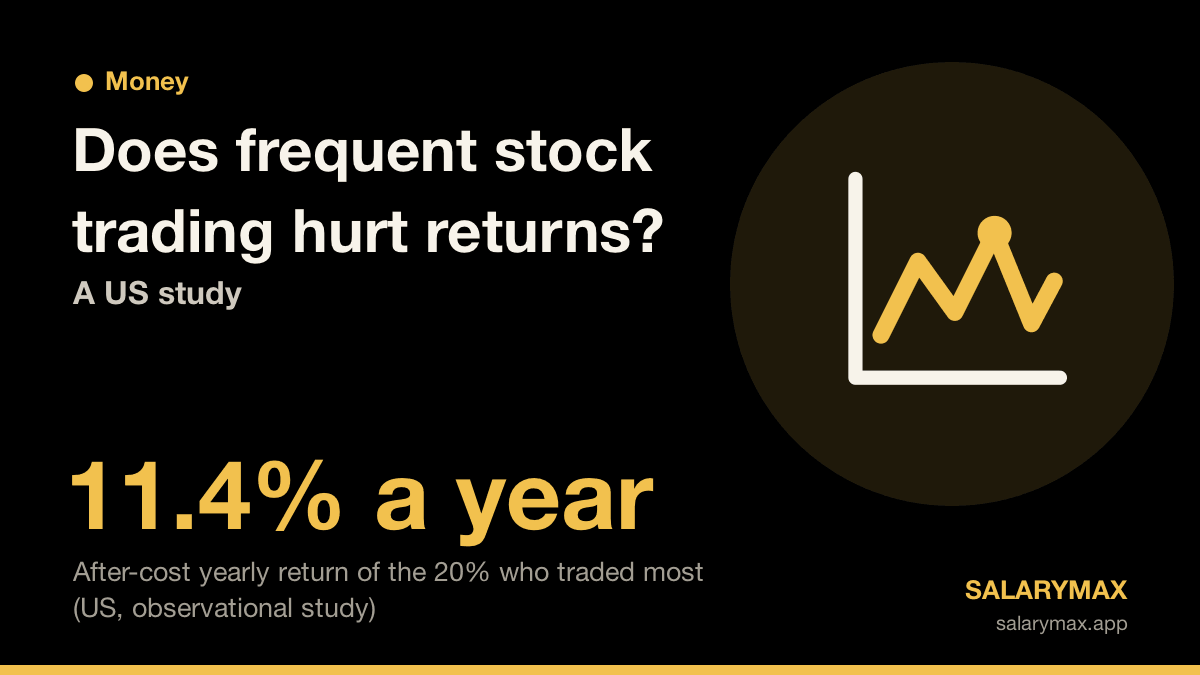
In a US study of 66,465 brokerage households (1991–96), the 20% who traded most earned 11.4% a year after costs, vs 17.9% for the market. Costs drove most of the gap.
The evidence behind this article
- Adjusted observational2
- Observational1
Based on observational data. It shows that two things go together, not that one causes the other.
3 sources・Countries studied: United States, Taiwan, Japan
How to read the kinds of evidence →What to do with this
When you feel the urge to buy or sell, decide tomorrow instead, and write down how many trades you made in the past year and what you paid in fees.
Many people assume that buying and selling shares often is a smart way to grow their money. A study of about 66,000 households at a US brokerage found the opposite pattern: the group that traded most fell well short of the market once costs were taken out. Here is what the research looked at and how to read it. This article does not recommend any product or stock.
Key points
- A study of 66,465 households at a US discount broker (a low-fee brokerage) from 1991 to 1996 found that the fifth of households that traded most earned 11.4% a year after costs. The market as a whole returned 17.9% over the same period.
- In the same study, returns before costs were almost the same for households that traded a lot and those that traded little. Most of the gap came from the costs paid on each trade. These are averages from observational data, not a forecast for any one person.
- A study using the complete trading records of all investors in Taiwan found that trading lowered the performance of individual investors as a group by 3.8 percentage points a year.
How much less did the heaviest traders keep?
Brad Barber and Terrance Odean used account data from a large US discount brokerage. They followed the trades and holdings of 66,465 households that owned shares between 1991 and 1996.
The first finding was that households traded a lot. The average household replaced more than 75% of its stock holdings each year. The researchers split households into five groups by turnover, meaning the share of the portfolio bought and sold. The most active group turned over more than 8.8% of its holdings each month, or more than 250% a year.
After costs, the most active group earned 11.4% a year and the least active group earned 18.5%. The market index returned 17.9%, and the average household earned 16.4%.
Where did the gap come from? Trading costs and overconfidence
The striking part is what happened before costs. Gross returns for all five groups fell between 18.5% and 18.7% a year, which is almost no difference. What separated them was the cost of trading itself.
In this study, a round trip (buying and then selling) on a trade above $1,000 cost about 3% in commissions and about 1% in the bid-ask spread, the gap between buying and selling prices. The more often people traded, the more these costs added up. The authors conclude that the poor performance of the average household can be traced to the costs of this high level of trading.
Why would people keep making trades that do not pay off? The authors argue that overconfidence, the tendency to believe our own judgment is better than it is, can explain the high level of trading. They did not measure overconfidence directly, though. It is offered as an explanation that fits the results.
Taiwan shows a similar picture. Using the complete trading history of all investors there, a later study found that trading cut the performance of individual investors’ combined portfolio by 3.8 percentage points a year. Those losses were equal to 2.2% of Taiwan’s gross domestic product (GDP). Virtually all of the losses could be traced to aggressive orders, the kind placed to get a trade done right away.
How to read research on trading and returns
- It is observational data. Researchers did not assign people to trade more or less. Frequent and infrequent traders may differ in other ways from the start, so the study does not show that trading less will improve anyone’s returns.
- It describes customers of US discount brokers in the 1990s. The results reflect the trading costs of that time. The authors themselves note that customers of full-service brokers may trade differently. Lower costs could shrink the gap, but the basic mechanism stays the same: the more trades you make, the more costs pile up.
- The picture in Japan is mixed. A study of investor types on the Tokyo Stock Exchange found that individual investors had poor market timing, yet over short trading intervals their average selling price was higher than their average buying price. We found no Japanese study that compares trading frequency and returns account by account.
A small step for today
Investment decisions are personal. These steps simply make the number and cost of your trades visible.
- When you feel the urge to buy or sell, decide tomorrow instead, in the same spirit as the app habit “Waited a night before buying”.
- Write down how many trades you made in the past year and how much you paid in fees. It works like “Tracked spending”.
- For money you are setting aside, use a fixed automatic transfer, as in “Paid myself first”. That alone cuts the number of decisions you make while watching daily prices.
FAQ
Do you lose money by trading stocks too often?
In the US study of about 66,000 households, the most active group earned 11.4% a year after costs, below the 18.5% earned by the least active group. These are averages from observational data, so they do not predict what will happen to any individual.
Is frequent trading fine if fees are low?
This study cannot answer that on its own. Most of the gap came from commissions and the bid-ask spread, so lower costs would likely shrink it. However, the sources for this article do not include the same analysis run at today’s fee levels.
Why do people trade too much?
The authors argue that overconfidence, believing our own judgment is better than it is, can explain it. Their evidence is that households kept trading even though returns before costs were almost the same. Keep in mind that the study did not measure overconfidence itself.
Sources
- [X-barber-odean-2000] Barber & Odean (2000) Trading Is Hazardous to Your Wealth: The Common Stock Investment Performance of Individual Investors. The Journal of Finance.
- [X-barber-lee-liu-odean-2009] Barber, Lee, Liu & Odean (2009) Just How Much Do Individual Investors Lose by Trading? The Review of Financial Studies.
- [X-bae-yamada-ito-2006] Bae, Yamada & Ito (2006) How do Individual, Institutional, and Foreign Investors Win and Lose in Equity Trades? Evidence from Japan. International Review of Finance.
Studies describe average tendencies. This article is not a promise that a habit will lift your income, and it is not medical or investment advice. About these articles ・ Search & sources
Updated:
← All articles